
LESSON PLAN:
WWII by the Numbers: Charting and Graphing D-Day and WWII Data
Organizing and interpreting data is an important skill when analyzing historical events. Raw data are the building blocks for interpreting what happened in the past, what is going on in the present, and what may occur in the future. The following lesson plan asks students to create three types of graphs using statistics from D-Day and World War II and then analyze their results by answering interpretive questions.
Objective:
Students analyze the size and scope of World War II and D-Day by charting and graphing statistics and interpreting their findings.
Grade Level: 7-12
Standards:
History Thinking Standard 2—the student will engage in historical analysis and interpretation while utilizing visual and mathematical data.
Content Era 8 (1929-1945), Standard 3B—the student understands World War II and how the Allies prevailed.
Time Requirement: One class period.
Download a printable pdf version of this lesson plan
Directions:
1. Copy and pass out the worksheets and have students use the given data to create a line graph, a pie chart, and a bar graph, then answer the questions that follow. This activity can be an individual or group activity depending on your specific needs in the classroom.
2. Use the statistical data from the three activities to lead a short discussion of the size and scope of World War II and D-Day.
Assessment
Components for assessment include the completed worksheet and class discussion.
Enrichment:
Have students collect data (such as poll numbers, statistics, or forecasts) about any current event from the newspaper, magazines, or the Internet and organize that data in a graph, which includes a short essay explaining their source, their data, and their analysis.
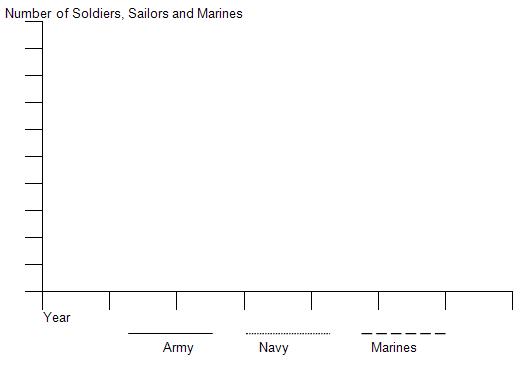
U.S. Active Military Personnel (1939-1945)
On a line graph as seen below, fill in both axes and plot and label the growth of each branch of the U.S. military during World War II. Use the type of lines shown for each branch. Then answer the questions below.
Army |
Navy |
Marines |
Total |
|
|---|---|---|---|---|
1939 |
189,839 |
125,202 |
19,432 |
334,473 |
1940 |
269,023 |
160,997 |
28,345 |
458,365 |
1941 |
1,462,315 |
284,427 |
54,359 |
1,801,101 |
1942 |
3,075,608 |
640,570 |
142,613 |
3,858,791 |
1943 |
6,994,472 |
1,741,750 |
308,523 |
9,044,745 |
1944 |
7,994,750 |
2,981,365 |
475,604 |
11,451,719 |
1945 |
8,267,958 |
3,380,817 |
474,680 |
12,123,445 |
A. What was the trend in the size of the U.S. military between 1939 and 1945?
B. What year saw the largest increase of military personnel and what event(s) brought about this increase?
C. From the data in this graph, what branch of service do you predict had the highest casualty rate during WWII?
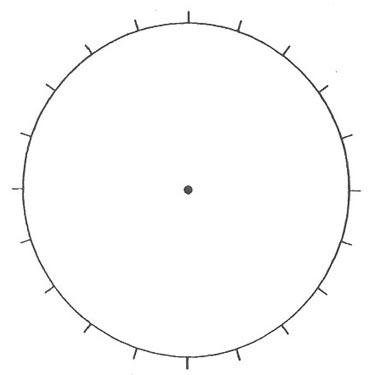
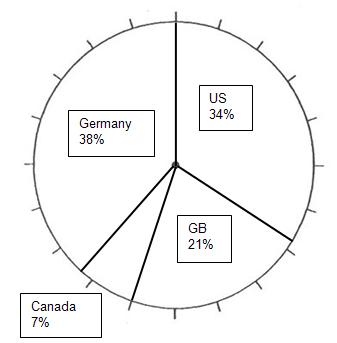
D-Day Combatants
Use these statistics from June 6, 1944—D-Day—to fill in and label the percentages of each country’s military force in Normandy on the pie chart. Then answer the questions below.
Country |
Number of Soldiers on D-Day |
Percentage |
|---|---|---|
*United States |
95,000 |
34% |
*Great Britain |
60,000 |
21% |
*Canada |
20,000 |
7% |
Germany |
105,000 |
38% |
*Allies
A. What country had the most troops in Normandy on D-Day?
B. What percentage of the troops at D-Day were Allied troops?
C. Why did the Allied commanders think it was necessary to attack with such a large number of soldiers?
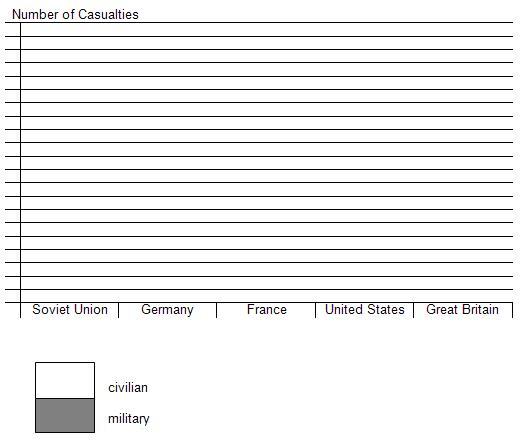
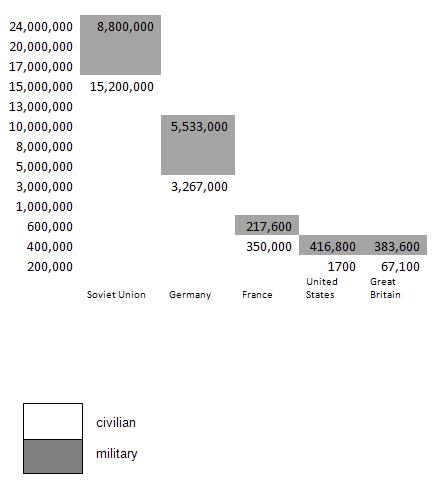
Casualties of World War II
Use the following statistics of WWII deaths to complete a bar graph. Label both axes. Use one bar per country and be sure to separate the number of military and civilian deaths for each country, as shown below. Answer the questions that follow.
Country |
Total Deaths |
% of Pre-War Population |
Military Deaths |
Civilian Deaths |
|---|---|---|---|---|
USSR |
24,000,000 |
13.88 |
8,800,000-10,700,000 |
13,300,000-15,200,000 |
Germany |
6,600,000-8,800,000 |
8-10.5 |
5,533,000 |
1,067,000-3,267,000 |
France |
567,600 |
1.35% |
217,600 |
350,000 |
United States |
418,500 |
0.32% |
416,800 |
1,700 |
Great Britain |
450,700 |
0.94% |
383,600 |
67,100 |
A. Which countries had more civilian deaths than military deaths?
B. What does this chart tell you about the consequences of war and the decisions by leaders to go to war?
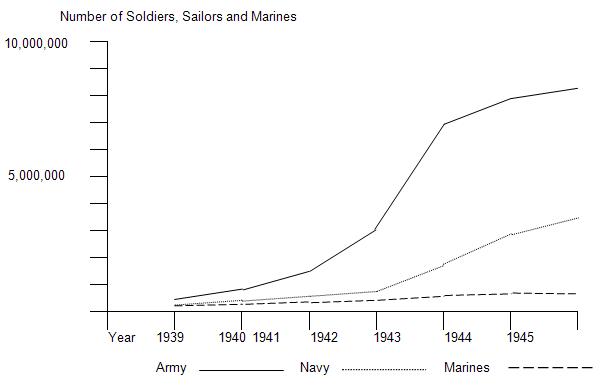
Answers to Activity Questions
U.S. Active Military Personnel (1939-1945)
D-Day Combatants
Casualties of World War II
Download a printable pdf version of this lesson plan
TAKE ACTION:


EDUCATION PROJECTS:
Student Travel – WWII Educational Tours
High school and college students, learn the leadership principles that helped win WWII on a trip to France or during a weeklong residential program in New Orleans. College credit is available, and space is limited.
See You Next Year! HS Yearbooks from WWII
Collected from across the United States, the words and pictures of these yearbooks present a new opportunity to experience the many challenges, setbacks and triumphs of the war through the eyes of America’s youth.
The Victory Gardens of WWII
Visit the Classroom Victory Garden Project website to learn about food production during WWII, find lesson plans and activities for elementary students, get tips for starting your own garden and try out simple Victory Garden recipes!
The Science and Technology of WWII
Visit our new interactive website to learn about wartime technical and scientific advances that forever changed our world. Incorporates STEM principles to use in the classroom.
Kids Corner: Fun and Games!
Make your own propaganda posters, test your memory, solve puzzles and more! Learn about World War II and have fun at the same time.
